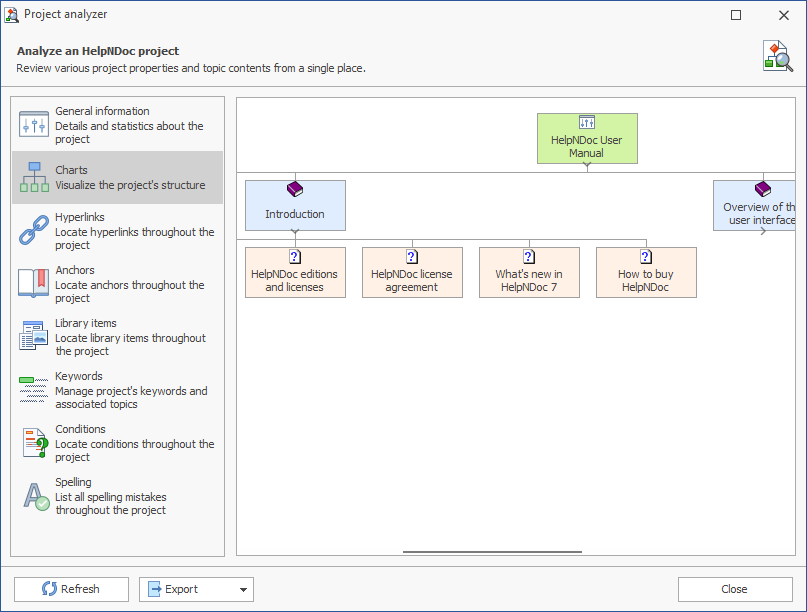
The project analyzer's "Charts" section provides an interactive visual representation of the project's structure (or table of contents). Clicking an item in the chart selects it in the table of contents and vice-versa.
The project analyzer's "Charts" section provides an interactive visual representation of the project's structure (or table of contents). Clicking an item in the chart selects it in the table of contents and vice-versa.